Sunday, 25 August 2013

Fearing the Fed not justified – FOMC statement already said all

Economic theory of the Chicago School states that participants in financial and commodity markets form rational expectations and thus, all information would be included in the prices. The developments in August demonstrated again that not all expectations and opinions voiced by traders and analysts are based on a rational analysis and information processing.

The US stock market reached an all-time high of the S&P 500 index following the FOMC meeting on July 31, 2013. But then the stock market for 2-1/2 weeks declined on fears the Fed could taper the bond purchasing program at the next FOMC meeting in September. Also the yield on 10yr US Treasury notes rose by almost 30 basis points in the same period and was only a whisker shy of the 2.90% mark.

But unlike in earlier situations, the fear in financial markets of the possibility the Fed might reduce the volume of bond buying played a role contributed to a recovery of precious metals prices. Quantitative easing is regarded as one reason for capital flows into emerging economies. With the fear the FOMC might decide to exit QE3 in September, international investors shifted funds from emerging economies back into Western economies. As a result, the US dollar weakened slightly against the major currencies as measured by the US dollar index.

The fears were driven to some extend also by comments from a few FOMC members. However, most of those members making statements about tapering opposed the program from the very beginning. But even more important, most critics of QE3 are non-voting members this year. Thus, many market participants expected more hints from the minutes of the recent FOMC meeting and at the same time feared the minutes would confirm the FOMC would decide to taper in September.


No doubt, minutes of a meeting could provide some further insights. Nevertheless, the FOMC statement already send the main message, namely that any decision to reduce the volume of bond purchases would be data dependent. And the economic data available at the FOMC meeting did not induce the committee to make a move towards tapering. Also data released after the July meeting does not provide a strong case for a decision to reduce the volume of bond purchases in September.

The minutes even provided arguments, which could reduce the likelihood for tapering at the next meeting. It has also been pointed out that tapering could increase the risk of moving towards deflation. This had also been discussed in this blog by turning the attention to the development of the core PCE deflator, which moved down towards the 1% level.
Unless there are shocks, there are normally no U-turns in the voting behavior of the FOMC members. This means that changes in monetary policy are indicated by an increasing number of members voting against the current stance of monetary policy instruments. However, the recent FOMC statement showed that one member voting against the majority at meetings earlier this year joint the majority at the July meeting and also voted for a continuation of the current policy.

Thus, the statement of the July FOMC meeting already provided enough hints that the minutes would not reveal new information, which would point to tapering in September. It could not be ruled out that the consensus of Wall Street economists might be right. However, the FOMC statement and the minutes as well as economic data released in August so far indicated that the odds are more for keeping the current volume of bond purchases of $85bn in total also at the September meeting.

At the US Treasury market, it should already be priced in that the FOMC will not continue to buy bonds at the current level forever. But given the moderate GDP growth and the low core PCE inflation far below the Fed target and that extremely accommodative monetary policy will keep the Fed Funds target rate at less than 0.25% well into 2015, the current yield level at the long end is attractive.   

Sunday, 18 August 2013

Some Comments on Gold

During the course of a week, we receive some e-mails with comments on precious metals markets. Normally, those comments will not be commented in this blog. However, this week, we decided to write about two articles.

The first article was titled “Will gold break its negative correlation with dollar?” and was written by the head of research employed by a gold investment company. She wrote about the market action on Monday and noted that the US dollar index was up and gold continued to climb higher. Furthermore, she wrote that now many analysts were asking if the yellow metal were breaking the negative correlation with the US dollar. In addition, this possibility would displease Deutsche Bank which reiterated that they were bullish on the US dollar and a firm dollar would cause headwinds for gold.

First, one swallow does not make a summer and one day off opposite movements between the US dollar index and gold does not imply that the negative correlation is breaking down. Correlation is a measure of linear co-movement of two variables, measured by their deviation from the respective mean. Even a high correlation (positive or negative) does not imply that every pair of observation would have to show the same sign. Furthermore, the correlation coefficient does not provide information how many times the two variable move in the same or in opposite direction.

Second, this head of research confuses correlation with causation. The US dollar is not the only fundamental factor having an impact on the price of gold. Crude oil is an important factor for headline consumer price inflation. Therefore, crude oil also has an impact on the gold price. The development of major stock markets, money market interest rates and bond yields also have an impact as many econometric analyses show. Thus, on some days, the other factors could more than compensate the impact of the US dollar on the price of gold. For example, a rise of crude oil prices due to the tensions in Egypt could be sufficiently strong to push gold higher while the US dollar index declines.

Third, in our quantitative fair value model for gold, the US dollar index has a negative regression coefficient. For other variables, there has been a change of the sign in the period starting January last year compared with some years before. However, the sign of the US dollar remained unchanged. Thus, the hope for a break of the negative correlation between the US dollar and gold is probably in vain.

The second article is titled “The hidden agenda behind the bear raid”. Of course, this is another article on a conspiracy theory about gold being manipulated. The author wrote that after the December 2012 FOMC meeting “…gold was driven back below the key psychological $1700 level during an unnaturally high volume hit in the middle of the night. No normal trader seeking to maximize returns would dump that kind of volume into the thin overnight market.” The author completely overlooks that gold is traded not only in the US, but also in Asian and European financial centers. Thus, physical gold is traded around the clock. When it is night time in the US, then it is already morning of the next day in Tokyo and Shanghai. For many Asian investors or traders, this is the first opportunity to react on events in the US, which are important for the price perspectives of gold. One should also keep in mind that the USD/JPY exchange rate is trading with higher volumes during Asian trading hours. Furthermore, with the election of PM Abe in Japan, there was a landslide shift in Japanese economic policy. The target of ending deflation and reaching a 2% CPI inflation rate within two years had consequences for the yen exchange rate. We showed in this blog that the downward move of gold was mainly driven by a firmer US dollar against the Japanese yen.

Furthermore, the author highlights that Goldman-Sachs came out on April 10 with a public recommendation to sell gold short. Goldman-Sachs’ gold analyst was bearish for quite some time before he gave this recommendation. Thus, it was not really new for those reading reports on the gold market at Bloomberg or ThomsonReuters terminals. For an investment bank, it is normal business to make trade recommendations to clients and to send those reports also to the media. The author concludes that “It seems much more likely that Goldman Sachs traders were already short the gold market and were looking to juice the downside as they already knew a stop run was coming.” It cannot be ruled out that traders at Goldman-Sachs were already short gold before this paarticular research recommendation was published in April. However, there are strict rules research departments have to obey. Analysts are not allowed to inform traders about their trade recommendations before they are send out to clients and are in the public domain. Compliance departments have a close eye that analyst do not violate the law because the company can be punished heavily. The fact that this recommendation had a strong impact on the price of gold is due to the reputation of Goldman-Sachs’ analyst who earned his reputation by making many correct calls on gold. Only if an analyst has a good track record or convincing fundamental arguments, then hedge funds or other institutional investors take a story seriously and put money on a recommendation. Thus, also the second argument for a manipulation of the gold market is not based on sound reasons.

The third indication for a manipulation would be the accumulation during April and May of unusually large positions in GDX puts with expiration in June. Those positions would have prevented gold from closing and holding above 1,400$/oz. And miraculously (from the author’s view point) gold collapsed another 125$ before the expiration in June and thus, send the puts deep into the money. However, there is no hidden conspiracy, but these moves could be explained in hindsight after quarterly releases of SEC filings.

There has been much talk in financial markets about JP Morgan and the London whale, which led to a loss of $6bn for the US bank. But there was – or better still is - also a whale in the gold market and his positions were well known due to the quarterly reporting of positions to the SEC. Many hedge funds invested in the SPDR Gold Trust ETF, but the largest stake holder is John Paulson and his hedge fund. After suffering already severe losses in the first quarter of 2013, Mr. Paulson had to react. Hedge fund sponsors could force the manager to take actions even if the manager remains convinced that he holds the right positions. This week, the SEC published data showing that Mr. Paulson has halved his holdings of the SPDR Gold Trust ETF in the second quarter.

Knowing the sheer size of his position and which impact it would have to sell 50% of the position, it is natural that a hedge fund manager would apply several instruments to limit the losses. Accumulating a position in puts is a smart strategy in this context. The puts secures a price for at least a part of the position, which has to be sold. Mr. Paulson lost $736m in the second quarter and his PFR Gold fund is down 65% in the first half of this year. Therefore, cutting the losses and liquidating part of the holdings could hardly be regarded as a market manipulation. The gold bulls also did not complain and called it a market manipulation when the accumulation of Mr. Paulson’s position pushed the price of gold higher.


Thus, all the arguments for a gold market manipulation could be rejected by sound explanations. However, it is a characteristic of all conspiracy theories that their devotees deny the facts. But as the case of Mr. Paulson and his hedge fund demonstrates, it is not only dangerous to swim with sharks but also with a whale. 

Sunday, 11 August 2013

Summertime and The Livin Is Easy

The title of the famous aria from George Gershwin’s opera Porgy and Bess might describe pretty well the living of those who could afford to spend currently their vacations. However, it certainly is not an appropriate description for those holding or trading positions in the metals markets. But there is also an exception in metals markets, spread traders being long in the PGMs and short in gold or silver could also enjoy an easy living.

Several factors make the life of a metals trader currently a hard one. Amongst those factors is the Fed.  While at Wednesday of the preceding week the FOMC statement provided no hint that tapering would be implemented at the next meeting, at the start of the week two hawkish FOMC members voiced that the FOMC should taper bond buying at the September meeting, while one dovish member would not rule out that the FOMC could decide as early as at the next meeting to reduce the volume of monthly bond purchases. Before the recent FOMC meeting, Fed chairman Bernanke calmed markets by emphasizing that the decision to taper would be data dependent.

However, the recent data does not provide any hint that the urge to reduce the volume of QE3 has increased. The recent revision of US GDP data is the result of a modification of the definition which items qualify as assets. But the economic activity did not become more or less dynamic due to the GDP revision. As pointed out last week, the core PCE deflator heads down and thus also provides no indication that tapering would be required to avoiding inflation. But the PCE deflator indicates that the FOMC would better wait and thus, might not make the same mistake as the BoJ some years ago. Nevertheless, the hawks within the FOMC oppose QE3 for orthodox beliefs instead of sound and rational economic reasons.

The problem is that the market is currently nervous and uncertain about the timing of the exit from QE3. Thus, many market participants do not distinguish whether a hawkish comment is made by a voting or non-voting member of the FOMC. Every statement from a hawkish FOMC member is immediately treated as it would be the next FOMC decision. Thus, it is no wonder that not only gold and silver, but also the US stock market and the base metals traded lower at the start of the week.

Three weeks ago, we wrote about the impact of Chinese macroeconomic data on base metal prices, in particular on copper. In this context, we noted that copper related data like copper imports have a lower explanatory power than general macroeconomic indicators like the Chinese manufacturing PMIs. This week, it were the import data for all goods and services as well as for come base metals (of course, copper was among them), which excited financial and commodity markets and lead to a turnaround. Factory production data on Friday pushed the precious and base metals further up to end the week in the plus.  


The Chinese trade balance in July was lower than expected at $17.8bn compared with a consensus forecast of $26.2bn. However, the data from the Customs Administration showed that exports rose 5.1% from a year ago while the consensus expected only an increase of 3%. Even stronger soared the imports, which jumped 10.9% from a year earlier. The surge of imports was more than five times of what economists predicted. The rise in exports is regarded as a sign that global demand is picking up, while the rocketing imports are considered as an indication that domestic demand in China is rebounding. While this interpretation is correct, analysts and traders might easily overlook one fact, which could lead to a disappointment later.

What counts for the calculation of the GDP and thus for GDP growth is not the percentage change of imports or exports, but the difference in local currency terms between ex- and imports. A widening of an export surplus leads to a bigger contribution of the external sector to the GDP and vice versa. Thus, July’s surge in imports could lead to a smaller surplus of the external sector and thus to a slower GDP growth.

The Chinese imports of unwrought copper and copper products increased from 380 thousand to 410.6 thousand tons in July. Compared to the same month of the previous year, this is an increase of 12%. Some analysts argued that this increase of copper imports would be due to financing reasons. However, this argument is not very convincing. Of course, inventories of copper or other base metals are used as collateral for short-term financing operations. But in this case, the inventory is held either voluntary in order to have sufficient metal for the production process or involuntary because the goods cannot be sold immediately and are stored. But copper imports have to be paid at a certain payment date, which could be some months into the future. Freight letters of copper shipped to China could be used to finance the imports and this is a usual procedure in international trade finance. But in this case, the copper will not be imported just to obtain a loan for paying the import. The driving reason for importing copper is the use for consumption and not for holding it at warehouses and using it as collateral. Thus, the rise of copper imports in July is a positive indication for economic activity in China.

Another positive indication for Chinese economic activity was the increase of industrial production in July. The industrial output rose 9.7% from the same month last year, while in June the year-over-year percentage increase was at 8.9%. Unlike the official Chinese manufacturing PMI, the HSBC manufacturing PMI slipped below the 50 threshold and indicated a slowdown of economic activity in the industrial sector. However, the industrial output expanded stronger as expected. Another example that markets better follow the official PMI because size matters. If large companies increase production, it has a stronger impact on overall output than the reduction of smaller companies.   


Overall, the Chinese data might improve sentiment towards the second biggest economy somewhat. However, the next official data release will be only in September. Thus, US economic data and the fear of Fed tapering in September might quickly regain the headlines and move the markets. Thus, even the second positive weekly close of gold is not a harbinger that gold might rally towards the 1,400$/oz level in the short run.  Also the industrial metals, which have stabilized, are not yet out of the woods.   

Sunday, 4 August 2013

No reason to be afraid of the Fed

After three weeks of gains, gold declined and ended last week with a loss of 22$ at 1,311$/oz. Also silver closed slightly lower than the previous Friday, while the PGMs managed to post a gain. The yield on the 10yr US Treasury note edged higher by 4bp to 2.60%. For gold and silver as well as the US Treasury note, the same factor was responsible for the falling prices, the fear that the Fed could taper the bond buying program at the next FOMC meeting in September.

At its two day meeting, the FOMC kept monetary policy unchanged as it was widely expected. The Committee decided to continue purchasing agency mortgage backed bonds and longer-term US Treasury paper at an unchanged volume of $85bn per month. Furthermore, the FOMC stated that it “… will continue its purchases of Treasury and agency mortgage-backed securities, and employ its other policy tools as appropriate, until the outlook for the labor market has improved substantially in a context of price stability.

Thus, there are two developments, which could induce the committee to change the current pace of monthly bond purchases. The first one would be an increase of the inflation rate well above the target rate of 2 percent combined with an increase of inflation expectations. It is well known that the favorite inflation gauge of the Fed is the core PCE deflator. The year over year percentage change of the core PCE deflator is showing a downward trend and the most recent inflation rate in June was only 1.1%. Thus, inflation is definitively not a problem, which would induce the FOMC to taper the bond purchase program this year. Quite the opposite is the case. The FOMC should be more worried that the core PCE inflation could continue to head further down. Therefore, maintaining the current pace of bond purchases is also an insurance policy against the risk of heading towards deflation. Fed chairman Bernanke has studied the policy mistakes made by the Bank of Japan intensively. Under his chairmanship, the Fed is not going to repeat those mistakes.

The second factor is the labor market. Financial and commodity markets focused on the non-farm payroll figure of the labor market report for July, which was released last Friday. The number of new created jobs came in at 162,000 while the consensus expected an addition to the payroll of 184K. Also the figures for the two preceding months had been revised down. Especially the bond markets and also gold and silver welcomed this report and reversed earlier losses to end up on the day. However, the focus of the FOMC is not the number of new jobs, but the unemployment rate. Of course, the faster the pace of new job creation, the quicker the unemployment rate could fall. But in July, the unemployment rate declined to 7.4%, more than the consensus expected, despite fewer new jobs than in the month before were created.

The US Bureau of Labor Statistics reported that the civilian labor force participation rate in July was 63.4 percent, which was little changed over the month. However, the number of unemployed persons declined to 11.5 million, which led to the stronger than expected decrease of the unemployment rate to 7.4%. Despite the seasonal adjustment procedures, one has to keep in mind that July and August are vacation months. In May and June, it had been observed that persons, who left the work force, returned and were looking for a job. Those persons considering to join the work force again might postpone this decision during the main summer vacation months because they regard the chances to find a job less favorable when decision makers are on holidays. But they might start looking for a job in September after the US Labor Day. Therefore, it would not be surprising to see another slight decline of the unemployment rate in August followed by an increase in September.

Nevertheless, even after the recent decline, the FOMC might come again to the conclusion that the unemployment rate is at an elevated level when the committee meets again in September. Thus, unlike the majority of Wall Street economists, we do not regard it as a done deal that the Fed would start tapering bond purchases in September.


Just when markets were too convinced that QE3 would last infinitely, Fed Chairman Bernanke sent a wake-up call during the testimony in May. However, reading the statements carefully, it was clear from the very beginning that a decision to reduce the volume of bond purchases would be data dependent. But the bond and precious metals market overreacted. The fear of tapering is still widespread as the development last week demonstrated. Thus, the yield on 10yr US Treasury notes might increase further. But we maintain our view that at a yield level of 2.75 or above they are attractive given the outlook for short-term interest rates, which the Fed is likely to keep at current levels into 2015.


For gold and silver, there are two opposite forces. The market’s fear of tapering by the Fed is limiting the upside potential of both metals due to the firmer stock markets and crude oil prices. It could even lead to falling prices. However, as long as the Fed waits, the US dollar might weaken against some major currencies, which would be positive for gold and silver. Thus, as long as the incoming data points to a continuation of bond purchases at the current pace, gold and silver might trade sideways with the slight bias to the upside. But once the data points to a higher likelihood for tapering, the two metals might come under stronger selling pressure again.

Sunday, 28 July 2013

Central Banks and Economic Data might weigh on Precious Metals

Gold rose further this past week and reached a high at 1,347$/oz. However, it seems that the rise was not driven primarily by the movement of the gold forward rates or the gold lease rates. The 1 month gold forward rate increased from -0.078 to -0.053% while the 1 month gold lease rate came down from 0.269 to 0.240%. Moreover, the major fundamental factor driving gold higher was the US dollar. The US dollar index weakened from 82.623 to 81.656. For the coming week, the US dollar might remain the decisive factor for gold and other precious metals.

The focus in the coming week is on the central bank policy in Europe with the ECB and the Bank of England holding rate setting meetings as well as on the manufacturing PMIs for various countries. And as usual at the first Friday of a new month, the US labor market report will be released.

When the minutes of the latest meeting of the BoE’s monetary policy committee (MPC) had been released, many analysts were disappointed that the MPC decided unanimously to keep the volume of bond holdings unchanged. However, such a result should not come as a surprise. It was the first meeting under the new BoE Governor, Mike Carney. For the two members, who voted for further bond buying, it would not be a wise to oppose the position of the new BoE Governor. Voting with the majority had not changed the result of a vote, but with joining the majority, they demonstrate support for Mr. Carney. Also for Mr. Carney, it was smart to vote with the majority. Voting for more quantitative easing and thus, against the majority, could have been interpreted easily as a defeat damaging his reputation.

However, more important than the actual policy decision was the medium-term guidance, which the BoE gave. Thus, monetary policy remains accommodative, but appears less likely that the MPC will vote next Thursday for further QE measures. The preliminary GDP figures for the second quarter, showing an increase of 0.6% over the first quarter, have reduced the likelihood for further stimulus measures.
At the latest press conference, also the ECB provided the financial markets with a medium-term guidance. ECB president Draghi stated that rates would be at the current or a lower level for an extended period of time. Thus, the kept the door for a further rate cut open. However, also at the forthcoming ECB council meeting a rate cut appears as less likely for two reasons.

First, council members from the Northern Eurozone periphery already opposed a further rate cut at the latest meeting. Their opposition has probably not weakened over the last few weeks. There might be a slight majority in the council for a cut of the key refinancing rate to 0.25%, however, the ECB council is looking for a broad consensus for policy measures. The status quo will probably prevail at least for another month.
Second, the flash estimate of the Eurozone manufacturing PMI shows a reading of 50.1. It is the first time since July 2011 that the manufacturing PMI would be above the critical threshold of 50 if confirmed by the final figure. In Spain, the unemployment rate declined for the first time since 2008, which is another indication that the economic situation in the Eurozone recovers gradually. The ECB always expressed the expectation that the Eurozone economy would improve in the second half of this year. Therefore, it is more likely that the council will take a wait and see attitude and keeps the powder dry.

For the US labor market report, the consensus is looking for a slightly slower pace of new job creation and predicts 180,000 (after 195K in June) additions to the payroll. The unemployment rate is expected to decline to 7.5% from 7.6%. Thus, the percentage of Wall Street economists predicting that the Fed would start tapering the bond purchases at the September FOMC meeting could increase.

For the government bond markets, these developments would be negative. The markets already reacted on the better than expected economic figures in the UK and the Eurozone. However, keeping the monetary policy unchanged by both central banks could dampen hopes for more monetary stimulus further and could lead to another round of bond selling. Whether the yield spread of 10 year US Treasury notes over German Bunds will decline further depends crucially on the US labor market report. A strong report could lead to a renewed spread widening. Higher bond yields are expected to have a negative impact on the precious metals as they imply higher opportunity costs.

The impact on the US dollar is not so clear. Unchanged monetary policy in Europe would be normally negative for the US dollar. However, a strong US labor market report could give the US dollar a push as the market would probably price in a higher likelihood for tapering at the September FOMC meeting. Nevertheless, even with a strong US labor market report, the euro might hold well against the US dollar in the case that the manufacturing PMIs for the Mediterranean countries also improve considerably. Indications for economic improvement, in particular in Spain and Italy, would reduce the credit risk of the government bonds, which should lead to narrower spreads of the German Bunds as the Eurozone benchmark. Of course, the spread tightening could be triggered by selling Bunds and buying Spanish or Italian government bonds. But also investors, which have reduced their exposure in the Eurozone might return as buyers if the economic outlook improves. This could support the euro against the US dollar.


For the precious metals, the US dollar index is more relevant than a single currency pair according to our quantitative fair value models. Thus, a strong US labor market report might be negative for precious metals by leading to a firmer US dollar against the basket of five currencies in the US dollar index. Thus, we expect that gold might end the coming week lower compared to the close of last Friday. But a disappointing US labor market report might push gold above the 1,350$oz level, which is regarded as a resistance level.    

Sunday, 21 July 2013

Dr. Copper moved to China

Copper, which is widely regarded as a leading indicator for economic activity and therefore dubbed as the metal with a PhD in economics, is down 12.5% since the end of 2012. Also other base metals have lost in 2013 so far. All base metals reached their high of the year in mid-February and then moved downwards. Thus, the testimony of Fed Chairman Bernanke, where he indicated the FOMC might taper the bond buying program at one of the next few FOMC meetings, could hardly explain the poor performance of base metals. Institutional investors have sold base metals already before this testimony in May.

In our fair value models, the US dollar index is also one of the explanatory variables for the price development of base metals. As many of the variables are not stationary and also show a seasonal pattern, the year-over-year percentage change had been applied in the models. The strength of the US dollar index following the change of economic policy in Japan (Abenomics) could explain the development of base metal prices to some extent.

When the fair value models were developed, the S&P 500 Index was the stock market index with the best explanatory power among the major stock indices. At this time, China had already risen to the world’s top copper consuming country. However, the S&P 500 index can not explain the decline of base metal prices because the US stock market posted strong gains while base metals moved in opposite direction.

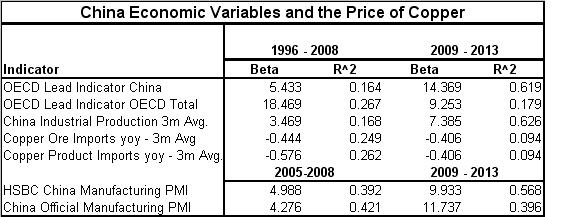
In many reports about the base metal markets, the gradual decline of Chinese GDP growth is often cited as a reason for weaker base metal prices. Therefore, we examined various Chinese macroeconomic variables whether they explain the development of the 3mth LME copper price better than they did before. In order to have enough observation also in the second subsample, the starting date for the second sample had been set to January 2009. However, in 2009 and also for most part of 2010, the development of Chinese leading economic variables and international leading indicators was very similar.

As the interest was only in the explanatory power of some macroeconomic variables for the development of the copper price, we estimated only some bivariate linear regression models instead of multivariate models.

When we developed our fair value models for the base metal prices, the OECD leading indicator for the total OECD explained the development of copper prices better than the OECD leading indicator for China. As shown in the table below, the price changes of copper reacted stronger (higher beta-coefficient) on changes of the leading indicator for the total OECD than on the one for China. Also the R-squared is higher for the OECD region in the estimation period ranging from January 1996 until December 2008.  However, this has reversed in the period following the financial crisis. While the impact of the Chinese leading indicator is now more than 2.6 times higher, the impact of the leading indicator for the OECD region has almost halved. Also striking is the difference in the R-squared. Now, the leading indicator for China could explain more than 60% of the variation of copper prices alone.


A similar development took place for the industrial production in China. As the yoy %-change of Chinese industrial production is very erratic, a 3mth moving average had been applied to smooth the development.

One would assume that Chinese copper imports would play an important role for the copper price. Many analysts had presented charts showing the LME copper price being highly correlated with Chinese copper imports. However, those analysts manipulated the charts in their studies because they showed copper imports in value terms. And it is quite natural that the copper price is highly correlated with the product of copper prices and imported volumes. But looking at Chinese copper imports in volume terms shows a different picture. The regression coefficient for copper ore imports as well as for copper product imports (also smoothed by a 3mth moving average) is negative. A possible explanation for this negative relationship might be that the more copper China imports and then refines, the more the supply of refined copper increases and thus, weighs on the price for refined copper. However, R-squared declined considerably after the financial crisis, which implies that Chinese copper imports contribute less to the explanation of copper price movements.

Manufacturing PMIs for China are only available since mid 2004 for the HSBC index and from 2005 for the official PMI. For both PMIs, the impact on copper prices has risen after the financial crisis and is more than twice the beta coefficient of the first sample period.  But only the HSBC manufacturing PMI contributes more to the explanation of copper price movements.
Chinese macroeconomic variables have a stronger impact on copper prices after the financial crisis than they had before the collapse of Lehmann Brothers. But China was the major copper consuming country also before the financial crisis. Maybe it was the Chinese policy to stimulate the economy and to buy the metal for strategic reserves, which have strengthened the impact of Chinese macroeconomic variables on the movements of the copper price. However, the chart above indicates that the OECD leading indicator for the total OECD region moved most of the time in the same direction as the leading indicator for China. But in the second half of 2012, the leading indicator for the OECD increased, while the Chinese leading indicator headed further down. Therefore, the recovery of copper prices in the yoy-comparison was only short-lived.


Obviously, Dr. Copper moved to China. And there, the metal with a PhD in economics ignores what is going on in the rest of the world. The USA is still the second top copper consumer and the US construction sector is improving further. But this is not reflected in the copper futures the CME where large speculative investors are still holding a net short-position, albeit reduced from 28,048 to 22,380 contracts according to the latest CFTC report on the “Commitment of Traders”. As long as the focus remains only on China, base metals might have only limited recovery potential.

Sunday, 14 July 2013

Negative GOFO – no Harbinger for Rally in Gold

It was the big headline in a market report that gold forward rates (GOFO) were negative for the first time since the collapse of Lehman Brothers in 2008. While this information is correct, it should suggest that this marks again a turning point for the price of gold. While Lehman Brothers went bankrupt on September 15, 2008, it was only 44 days later that gold reached its low at 680$/oz and started the rise to the new all-time high at 1920$/oz on September 6, 2011.  However, the 1month gold forward rate turned negative only in November 2007. The sequence of events is similar this year. Gold reached a new low in late June and then recovered before GOFO rates turned negative. But the similarities end here.

Negative GOFO rates imply that spot gold with delivery after 2 business days is trading higher than the price for gold fixed today for delivery in 1, 2, 3 or 6 months. The 1 year gold forward rate remained positive last week. Thus, the gold market turned from contango (the normal state in this market) into backwardation, which is unusual for the precious metals. In other commodity markets, backwardation is often explained by the concept of convenience yield. However, this concept does not apply for gold and silver as there is an active market for lending these two precious metals. Moreover, gold forward rates can not form freely in the market. They are bound by money market interest rates and the lease rates in the market for lending gold. Arbitrage could set in, if the following identity equation is violated:

            Gold forward rate = money market rate – gold lease rate.

The money market rate is normally the US dollar LIBOR for the corresponding duration of the gold forward.

This identity equation also helps to explain why the gold forward rate turns negative. Either the LIBOR rate has to fall or the gold lease rate has to increase or there is a combination of both factors.

In 2008, immediately with the collapse of Lehman Brothers, the 1mth gold forward rate increased as the LIBOR rate, which includes bank risk, rose stronger than the gold lease rate. However, already at the end of September, the forward rate reached its peak and turned around. This was triggered by a jump in the gold lease rate. But from the middle of October, both rates fell. Due to the Fed policy, the LIBOR rate fell stronger than the gold lease rate, which remained above 1.25%. The 1mth LIBOR was briefly below the gold lease rate in November 2008, which caused the negative gold forward rate.  

However, in 2013, the 1mth LIBOR rate showed a downward bias, but the overall range was just less than 2 basis points. This is not enough to explain the negative gold forward rate of -0.11% on Wednesday. Thus, unlike in 2008, the movement of the gold lease rates was the responsible factor for the backwardation in the gold market.

The crucial question is thus, which factors drive the gold lease rate. Our quantitative research identified two factors, which explain around 85% of the movements of the 1mth gold lease rate since January 2012, the price of gold and the gold inventories in CME warehouses. The chart above shows the weekly gold lease rate and the spot gold price. It is obvious that the gold lease rate also started to increase when gold resumed its downward move leading to the low in late June. Hedge funds not only sold physical gold they held via ETFs but also sold gold short in the physical market. As those deals usually have to be settled after 2 business days, the hedge funds have to lend the gold from institutional holders. This demand already led to a steady increase of the lease rate.

The next chart shows the development of the gold stocks held in CME warehouses together with the gold lease rate and the model estimate of the lease rate. As long as the inventories are abandoned, hedge funds being short physical gold don’t have to worry about covering their shorts. They could meet the obligation to return the gold lend by buying in the spot market or by purchasing futures with expiration before they have to make delivery. Then, they can take physical delivery from the long future and meet their obligation to return the gold back to the lender. However, if inventories fall rapidly, the risk increases for the borrower to obtain gold right in time by purchasing a gold future and take delivery. But also the risk for the lender increases that the gold will be returned at the agreed date. Thus, lenders get hesitant to enter new lease agreements and/or demand higher risk premiums for lending gold.


After the speech of Fed chairman Bernanke last Wednesday, following the release of the FOMC minutes, the gold lease rates came down. As an immediate tapering of the bond purchasing program got less likely, also the short speculation against gold declined, which contributed to the decline of the lease rates. The US dollar weakened against the major currencies and also the bond markets recovered. However, it remains only a question of timing that the Fed will reduce the volume of being bonds. Thus, the medium-term outlook for a firmer US dollar against the major currency remains intact. Therefore, the upside potential for gold appears to be limited and the negative gold lease rate is in no way a harbinger for a rally in the gold market like after the collapse of Lehman Brothers. On the other hand, as long as gold inventories held in CME warehouses decline, the risk for selling gold short increases. This might limit also the downside risk for the gold price. However, all in all, the risk for gold appears to be more biased to the downside despite the recovery last week.