Sunday 28 July 2013

Central Banks and Economic Data might weigh on Precious Metals

Gold rose further this past week and reached a high at 1,347$/oz. However, it seems that the rise was not driven primarily by the movement of the gold forward rates or the gold lease rates. The 1 month gold forward rate increased from -0.078 to -0.053% while the 1 month gold lease rate came down from 0.269 to 0.240%. Moreover, the 
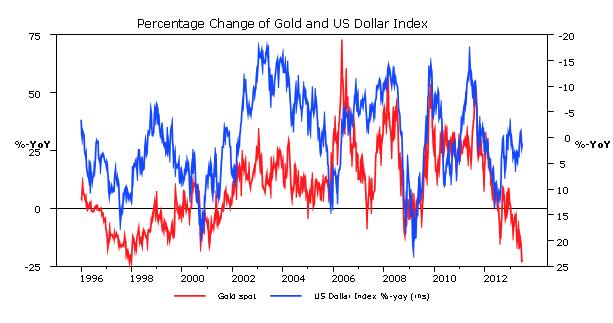
major fundamental factor driving gold higher was the US dollar. The US dollar index weakened from 82.623 to 81.656. For the coming week, the US dollar might remain the decisive factor for gold and other precious metals.

The focus in the coming week is on the central bank policy in Europe with the ECB and the Bank of England holding rate setting meetings as well as on the manufacturing PMIs for various countries. And as usual at the first Friday of a new month, the US labor market report will be released.

When the minutes of the latest meeting of the BoE’s monetary policy committee (MPC) had been released, many analysts were disappointed that the MPC decided unanimously to keep the volume of bond holdings unchanged. However, such a result should not come as a surprise. It was the first meeting under the new BoE Governor, Mike Carney. For the two members, who voted for further bond buying, it would not be a wise to oppose the position of the new BoE Governor. Voting with the majority had not changed the result of a vote, but with joining the majority, they demonstrate support for Mr. Carney. Also for Mr. Carney, it was smart to vote with the majority. Voting for more quantitative easing and thus, against the majority, could have been interpreted easily as a defeat damaging his reputation.

However, more important than the actual policy decision was the medium-term guidance, which the BoE gave. Thus, monetary policy remains accommodative, but appears less likely that the MPC will vote next Thursday for further QE measures. The preliminary GDP figures for the second quarter, showing an increase of 0.6% over the first quarter, have reduced the likelihood for further stimulus measures.
At the latest press conference, also the ECB provided the financial markets with a medium-term guidance. ECB president Draghi stated that rates would be at the current or a lower level for an extended period of time. Thus, the kept the door for a further rate cut open. However, also at the forthcoming ECB council meeting a rate cut appears as less likely for two reasons.

First, council members from the Northern Eurozone periphery already opposed a further rate cut at the latest meeting. Their opposition has probably not weakened over the last few weeks. There might be a slight majority in the council for a cut of the key refinancing rate to 0.25%, however, the ECB council is looking for a broad consensus for policy measures. The status quo will probably prevail at least for another month.
Second, the flash estimate of the Eurozone manufacturing PMI shows a reading of 50.1. It is the first time since July 2011 that the manufacturing PMI would be above the critical threshold of 50 if confirmed by the final figure. In Spain, the unemployment rate declined for the first time since 2008, which is another indication that the economic situation in the Eurozone recovers gradually. The ECB always expressed the expectation that the Eurozone economy would improve in the second half of this year. Therefore, it is more likely that the council will take a wait and see attitude and keeps the powder dry.

For the US labor market report, the consensus is looking for a slightly slower pace of new job creation and predicts 180,000 (after 195K in June) additions to the payroll. The unemployment rate is expected to decline to 7.5% from 7.6%. Thus, the percentage of Wall Street economists predicting that the Fed would start tapering the bond purchases at the September FOMC meeting could increase.

For the government bond markets, these developments would be negative. The markets already reacted on the better than expected economic figures in the UK and the Eurozone. However, keeping the monetary policy unchanged by both central banks could dampen hopes for more monetary stimulus further and could lead to another round of bond selling. Whether the yield spread of 10 year US Treasury notes over German Bunds will decline further depends crucially on the US labor market report. A strong report could lead to a renewed spread widening. Higher bond yields are expected to have a negative impact on the precious metals as they imply higher opportunity costs.

The impact on the US dollar is not so clear. Unchanged monetary policy in Europe would be normally negative for the US dollar. However, a strong US labor market report could give the US dollar a push as the market would probably price in a higher likelihood for tapering at the September FOMC meeting. Nevertheless, even with a strong US labor market report, the euro might hold well against the US dollar in the case that the manufacturing PMIs for the Mediterranean countries also improve considerably. Indications for economic improvement, in particular in Spain and Italy, would reduce the credit risk of the government bonds, which should lead to narrower spreads of the German Bunds as the Eurozone benchmark. Of course, the spread tightening could be triggered by selling Bunds and buying Spanish or Italian government bonds. But also investors, which have reduced their exposure in the Eurozone might return as buyers if the economic outlook improves. This could support the euro against the US dollar.


For the precious metals, the US dollar index is more relevant than a single currency pair according to our quantitative fair value models. Thus, a strong US labor market report might be negative for precious metals by leading to a firmer US dollar against the basket of five currencies in the US dollar index. Thus, we expect that gold might end the coming week lower compared to the close of last Friday. But a disappointing US labor market report might push gold above the 1,350$oz level, which is regarded as a resistance level.    

Sunday 21 July 2013

Dr. Copper moved to China

Copper, which is widely regarded as a leading indicator for economic activity and therefore dubbed as the metal with a PhD in economics, is down 12.5% since the end of 2012. Also other base metals have lost in 2013 so far. All base metals reached their high of the year in mid-February and then moved downwards. Thus, the testimony of Fed Chairman Bernanke, where he indicated the FOMC might taper the bond buying program at one of the next few FOMC meetings, could hardly explain the poor performance of base metals. Institutional investors have sold base metals already before this testimony in May.

In our fair value models, the US dollar index is also one of the explanatory variables for the price development of base metals. As many of the variables are not stationary and also show a seasonal pattern, the year-over-year percentage change had been applied in the models. The strength of the US dollar index following the change of economic policy in Japan (Abenomics) could explain the development of base metal prices to some extent.

When the fair value models were developed, the S&P 500 Index was the stock market index with the best explanatory power among the major stock indices. At this time, China had already risen to the world’s top copper consuming country. However, the S&P 500 index can not explain the decline of base metal prices because the US stock market posted strong gains while base metals moved in opposite direction.

In many reports about the base metal markets, the gradual decline of Chinese GDP growth is often cited as a reason for weaker base metal prices. Therefore, we examined various Chinese macroeconomic variables whether they explain the development of the 3mth LME copper price better than they did before. In order to have enough observation also in the second subsample, the starting date for the second sample had been set to January 2009. However, in 2009 and also for most part of 2010, the development of Chinese leading economic variables and international leading indicators was very similar.

As the interest was only in the explanatory power of some macroeconomic variables for the development of the copper price, we estimated only some bivariate linear regression models instead of multivariate models.

When we developed our fair value models for the base metal prices, the OECD leading indicator for the total OECD explained the development of copper prices better than the OECD leading indicator for China. As shown in the table below, the price changes of copper reacted stronger (higher beta-coefficient) on changes of the leading indicator for the total OECD than on the one for China. Also the R-squared is higher for the OECD region in the estimation period ranging from January 1996 until December 2008.  However, this has reversed in the period following the financial crisis. While the impact of the Chinese leading indicator is now more than 2.6 times higher, the impact of the leading indicator for the OECD region has almost halved. Also striking is the difference in the R-squared. Now, the leading indicator for China could explain more than 60% of the variation of copper prices alone.


A similar development took place for the industrial production in China. As the yoy %-change of Chinese industrial production is very erratic, a 3mth moving average had been applied to smooth the development.

One would assume that Chinese copper imports would play an important role for the copper price. Many analysts had presented charts showing the LME copper price being highly correlated with Chinese copper imports. However, those analysts manipulated the charts in their studies because they showed copper imports in value terms. And it is quite natural that the copper price is highly correlated with the product of copper prices and imported volumes. But looking at Chinese copper imports in volume terms shows a different picture. The regression coefficient for copper ore imports as well as for copper product imports (also smoothed by a 3mth moving average) is negative. A possible explanation for this negative relationship might be that the more copper China imports and then refines, the more the supply of refined copper increases and thus, weighs on the price for refined copper. However, R-squared declined considerably after the financial crisis, which implies that Chinese copper imports contribute less to the explanation of copper price movements.

Manufacturing PMIs for China are only available since mid 2004 for the HSBC index and from 2005 for the official PMI. For both PMIs, the impact on copper prices has risen after the financial crisis and is more than twice the beta coefficient of the first sample period.  But only the HSBC manufacturing PMI contributes more to the explanation of copper price movements.
Chinese macroeconomic variables have a stronger impact on copper prices after the financial crisis than they had before the collapse of Lehmann Brothers. But China was the major copper consuming country also before the financial crisis. Maybe it was the Chinese policy to stimulate the economy and to buy the metal for strategic reserves, which have strengthened the impact of Chinese macroeconomic variables on the movements of the copper price. However, the chart above indicates that the OECD leading indicator for the total OECD region moved most of the time in the same direction as the leading indicator for China. But in the second half of 2012, the leading indicator for the OECD increased, while the Chinese leading indicator headed further down. Therefore, the recovery of copper prices in the yoy-comparison was only short-lived.


Obviously, Dr. Copper moved to China. And there, the metal with a PhD in economics ignores what is going on in the rest of the world. The USA is still the second top copper consumer and the US construction sector is improving further. But this is not reflected in the copper futures the CME where large speculative investors are still holding a net short-position, albeit reduced from 28,048 to 22,380 contracts according to the latest CFTC report on the “Commitment of Traders”. As long as the focus remains only on China, base metals might have only limited recovery potential.

Sunday 14 July 2013

Negative GOFO – no Harbinger for Rally in Gold

It was the big headline in a market report that gold forward rates (GOFO) were negative for the first time since the collapse of Lehman Brothers in 2008. While this information is correct, it should suggest that this marks again a turning point for the price of gold. While Lehman Brothers went bankrupt on September 15, 2008, it was only 44 days later that gold reached its low at 680$/oz and started the rise to the new all-time high at 1920$/oz on September 6, 2011.  However, the 1month gold forward rate turned negative only in November 2007. The sequence of events is similar this year. Gold reached a new low in late June and then recovered before GOFO rates turned negative. But the similarities end here.

Negative GOFO rates imply that spot gold with delivery after 2 business days is trading higher than the price for gold fixed today for delivery in 1, 2, 3 or 6 months. The 1 year gold forward rate remained positive last week. Thus, the gold market turned from contango (the normal state in this market) into backwardation, which is unusual for the precious metals. In other commodity markets, backwardation is often explained by the concept of convenience yield. However, this concept does not apply for gold and silver as there is an active market for lending these two precious metals. Moreover, gold forward rates can not form freely in the market. They are bound by money market interest rates and the lease rates in the market for lending gold. Arbitrage could set in, if the following identity equation is violated:

            Gold forward rate = money market rate – gold lease rate.

The money market rate is normally the US dollar LIBOR for the corresponding duration of the gold forward.

This identity equation also helps to explain why the gold forward rate turns negative. Either the LIBOR rate has to fall or the gold lease rate has to increase or there is a combination of both factors.

In 2008, immediately with the collapse of Lehman Brothers, the 1mth gold forward rate increased as the LIBOR rate, which includes bank risk, rose stronger than the gold lease rate. However, already at the end of September, the forward rate reached its peak and turned around. This was triggered by a jump in the gold lease rate. But from the middle of October, both rates fell. Due to the Fed policy, the LIBOR rate fell stronger than the gold lease rate, which remained above 1.25%. The 1mth LIBOR was briefly below the gold lease rate in November 2008, which caused the negative gold forward rate.  

However, in 2013, the 1mth LIBOR rate showed a downward bias, but the overall range was just less than 2 basis points. This is not enough to explain the negative gold forward rate of -0.11% on Wednesday. Thus, unlike in 2008, the movement of the gold lease rates was the responsible factor for the backwardation in the gold market.

The crucial question is thus, which factors drive the gold lease rate. Our quantitative research identified two factors, which explain around 85% of the movements of the 1mth gold lease rate since January 2012, the price of gold and the gold inventories in CME warehouses. The chart above shows the weekly gold lease rate and the spot gold price. It is obvious that the gold lease rate also started to increase when gold resumed its downward move leading to the low in late June. Hedge funds not only sold physical gold they held via ETFs but also sold gold short in the physical market. As those deals usually have to be settled after 2 business days, the hedge funds have to lend the gold from institutional holders. This demand already led to a steady increase of the lease rate.

The next chart shows the development of the gold stocks held in CME warehouses together with the gold lease rate and the model estimate of the lease rate. As long as the inventories are abandoned, hedge funds being short physical gold don’t have to worry about covering their shorts. They could meet the obligation to return the gold lend by buying in the spot market or by purchasing futures with expiration before they have to make delivery. Then, they can take physical delivery from the long future and meet their obligation to return the gold back to the lender. However, if inventories fall rapidly, the risk increases for the borrower to obtain gold right in time by purchasing a gold future and take delivery. But also the risk for the lender increases that the gold will be returned at the agreed date. Thus, lenders get hesitant to enter new lease agreements and/or demand higher risk premiums for lending gold.


After the speech of Fed chairman Bernanke last Wednesday, following the release of the FOMC minutes, the gold lease rates came down. As an immediate tapering of the bond purchasing program got less likely, also the short speculation against gold declined, which contributed to the decline of the lease rates. The US dollar weakened against the major currencies and also the bond markets recovered. However, it remains only a question of timing that the Fed will reduce the volume of being bonds. Thus, the medium-term outlook for a firmer US dollar against the major currency remains intact. Therefore, the upside potential for gold appears to be limited and the negative gold lease rate is in no way a harbinger for a rally in the gold market like after the collapse of Lehman Brothers. On the other hand, as long as gold inventories held in CME warehouses decline, the risk for selling gold short increases. This might limit also the downside risk for the gold price. However, all in all, the risk for gold appears to be more biased to the downside despite the recovery last week.

Sunday 7 July 2013

It is only the Fed

The slogan “it is the economy, stupid” is attributed to Bill Clinton’s first presidential election campaign. For many market participants, today’s version had to be “it is only the Fed, stupid”.

There is much discussion, especially in Germany about the independence of the ECB. However, this discussion centers on independence from fiscal policies of the eurozone member countries. But even the head of the German Bundesbank, Mr. Weidman, the strongest opponent of OMT on the fear the ECB would lose it independence, never regarded the ECB monetary policy as being dictated by the FOMC. However, this had been a widespread believe in financial markets.

The best example for this unjustified believe were the comments from some traders quoted by ThomsonReuters after the release of the final figures of the PMI for the eurozone and some member countries. As the PMI was slightly stronger than expected, bonds and stocks had been sold on expectations that the ECB would end it expansionary monetary policy soon (see also comment from Monday, July 1, 2013).  But the eurozone is still in a recession and GDP growth forecasts for the strongest economy, Germany, had been revised lower lately by some institutions to a mere +0.3% in this year.

Unlike the Fed, the ECB has only a single mandate of maintaining price stability. The ECB’s inflation target is to keep harmonized CPI inflation close to but below 2% in the medium-term. This allows even for some temporary overshooting of the target as long as the medium term inflation outlook remains well anchored. But in a recessionary economic environment, there is little underlying inflation risk. Thus, it is not rational expecting the ECB to end the expansionary monetary policy only because some PMI figures approach the 50 threshold.

Despite earlier comments from ECB president Draghi, financial markets remained in irrational mode. This induced the ECB council to send another clear message to financial markets. Breaking with the tradition of stating that the ECB council is not pre-committed, the ECB council stated that the key interest rates will stay at the current or lower level for an extended period of time. But unlike the Fed, the ECB gave no clear guidance how long this extended period will last. Questions during the press conference about the duration were only answered by Mr. Draghi as “not 6 month, not 12 months, but by an extended period”.

Similarly, it was also not rational to expect the BoE to end expansionary monetary policy anytime soon. The MPC did not embark on another round of bond purchases, but also did not send any indication there might be a shift towards a restrictive policy. Thus, whether the statement made by the BoE governor Carney was driven primarily by the change at the helm of the institution or by the irrationality of financial markets is of minor importance.  What counts is the message itself that monetary policy remains accommodative.

In the US, the labor market report has been seen as another indication that tapering the bond buying program by the Fed would be imminent. Two major banks, Goldman-Sachs and JP Morgan, now have revised their forecast and also expect the FOMC to announce at the September meeting to reduce the volume of monthly bond purchases. From our point of view, the labor market report was a good one, but not one pointing to any urge for the FOMC to scale down QE3.

The FOMC statements always refer to the unemployment rate as the second target and not to the non-farm payroll figure. Of course, a high number of newly created jobs month after month are one important factor for reducing the unemployment rate. But another important factor is the development of the civilian workforce. In the second quarter, the workforce increased by more than 800K to 155,835 thousand persons. In the quarters before, the workforce declined as many persons unable to find a job left the workforce. With the improved economic outlook, some of those leavers return again. This was the reason that the unemployment rate remained unchanged at 7.6% despite more new jobs than predicted had been created. It has to be expected that the increase of the workforce is going to continue. This return to the workforce is dampening the decline of the unemployment rate. But if the unemployment rate remains at the current level, it gets less likely that the FOMC will vote for reducing the volume of QE3. Whether job creation will be sufficiently strong to reduce the unemployment rate over the summer months has to be seen. But that the Fed enters tapering in September is not yet a done deal.

Thus, the outlook for monetary policy is divergence in the direction. In Japan, the target is to reach a CPI inflation of 2% within 2 years, which requires the BoJ to increase its balance sheet. The ECB and the BoE will remain expansionary of still some time. Only the Fed has currently an exit plan, but his plan is data dependent, but will not lead to an increase of interest rate target. Therefore, there should be little movement in short-term interest rates. It should then be the long-term government bond yields, which drive the movement of foreign exchange rates.

After the release of the US labor market report, the yield on the 10yr US T-notes jumped from 2.52% before the Independence Day to 2.74%. The spread over 10yr German Bunds widened from 85 to 104 basis points. Weakness in the US Treasury market is also pulling the yields on other safe haven government bonds higher, but not at the same magnitude. Thus, the spreads are widening and lead to a firmer US dollar.

At the current level, 10yr US Treasury notes start to get attractive for carry-trades. However, for financial institutions to enter such trades, also the upside risk has to be limited. This is at present not the case, as the uncertainty in the US Treasury market is likely to stay until the FOMC has made a clear decision and does not only lay out the road map. Thus, we still expect that yields on 10yr US Treasury notes could rise towards 3% before stronger entering of carry trades sets in. This implies that the US dollar could strengthen further against other major currencies.

Last week, we pointed out that the negative link between precious metals prices and the US dollar index remain well intact, but that the regression coefficients between precious metals and the S&P index as well as the US Treasury yield had reversed and became negative. Thus, a further rise of US Treasury yields is likely to exercise two negative impacts on the performance of precious metals, one directly and indirectly via the foreign exchange markets and a rising US Dollar index. Thus, also the third quarter, which just started, appears to be a negative on for the precious metals.


Monday 1 July 2013

Darwin and Financial Markets

Darwin’s evolution theory states that the strongest species survive. This has also become knows as “survival of the fittest”. However, this appears not to be the case in financial markets. Here the cheapest and not the smartest staff members of financial institutions appear to have survived the financial crisis. The most recent example is delivered by comments from traders following the release of the PMI data for the eurozone and member countries on July 1st, 2013.

The final PMI came in slightly above the flash estimate and the consensus forecast for the eurozone at 48.8, which was one tenth of a percentage point above the consensus. European stock markets, turned negative after being in the plus before the data release. Within 20 minutes, the DAX index lost 0.9% compared to the preceding close. Reuters reported “European shares turned negative on Monday after euro zone manufacturing activity showed signs of stabilisation last month, which traders said sparked concerns of tightening of European Central Bank monetary policy.”

This is ridiculous! Only last week, ECB president Draghi indicated that the ECB has still room to maneuver, which implies that the ECB could cut rates further. Leading European economists polled by a German business daily recommend lowering the key refinancing rate further to 0.25% at the ECB council meeting later this week.

Furthermore, the eurozone PMI is still below the 50 threshold, which is widely regarded as the threshold between contraction and expansion. Thus, the improvement of the PMI is just an indication that the eurozone might come out of the recession later this year. The capacity utilization in the eurozone is far from pointing to any inflationary pressure. The situation in the labor market is dismal in many countries of the eurozone, especially in the South. Therefore, any improvement of the economic situation is currently highly welcomed by the ECB and not a reason of concern.

Also price stability, the ECB’s main target, is not endangered. The flash estimate of the June harmonized CPI inflation in the eurozone edged up from 1.4% to 1.6%. However, this reading is still comfortably below the upper level of the ECB inflation target. Furthermore, the pick-up of the inflation rate is attributable to seasonal food prices, which is not a reason to tighten monetary policy.


Thus, fearing the ECB might tighten monetary policy any time soon is rather insane. It appears that some traders reacted more like skinner rats instead of using their brains.